Laurent J.
Catoire
Research Director

Miri
Garrigues
pHD STUDENT

Claudia
Zilian
Post-doc

Nahya
Nguyen Armengaud
M2 Student
Method
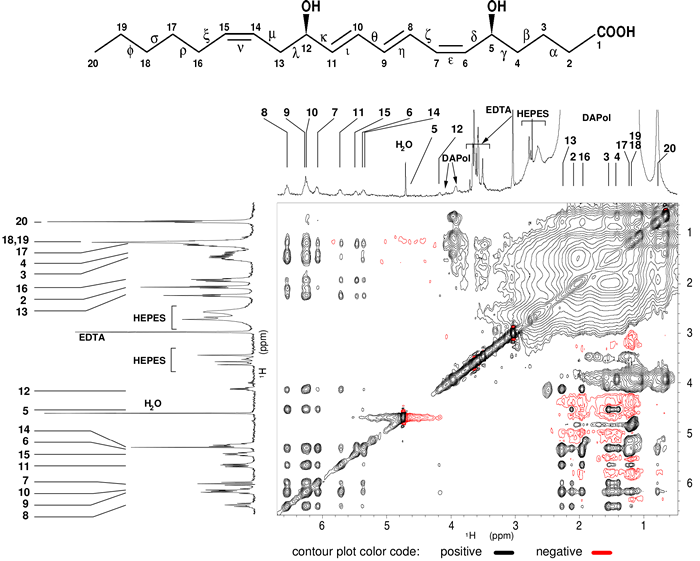
To determine the structures of agonist bound to BLT2, i) we maintained soluble and stable BLT2 receptor in solution associated to amphipols and, ii) the structures rely on the observation of intramolecular 1H-1H interactions through the dipolar cross-relaxation phenomenon [6] in a transferred mode [7] (Fig. 1).

Figure 1: Intra-dipolar 1H-1H LTB4 interactions in the presence of perdeuterated BLT2 receptor associated to a partially deuterated amphipol (DAPol) observed in a 2D 1H-1H NOESY spectrum.
The corresponding 1D 1H spectrum is shown above the 2D spectrum. In order to help in the identification of cross-peaks, the 1D spectrum of free LTB4 in solution is displayed on the left side. Numbers refer to the protons annotated on the LTB4 chemical structure above the spectrum.
Specific vs. non-specific interactions
An important bottleneck with this type of approach is to clearly identify specific intra-dipolar ligand interactions that do correspond to the interaction of the ligand with the receptor. This is particularly true in our case, given that i) there is a ~10× molar excess of ligand over the receptor, and ii) the ligand concentration (~150 µM) is almost three orders of magnitude above the Kd (Kd of LTB4 and 12-HHT are respectively ~200 and 60 nM), raising the possibility of non-specific bindings (Fig. 2). Thus, negative and positive controls are mandatory. Classically, competitive assays can be perform as positive controls and conversely the use of mutant receptors that do not specifically bind ligands under study. Taken together, these two kind of control experiments strongly help to identify specific intramolecular dipolar interactions.

Figure 2: Specific versus non-specific interactions.
With the help of competitive ligands or mutant receptors for which the specificity of binding is substantially reduced for the ligands under study, it is possible to clearly identify specific dipolar interactions (state III in this schematic). DAPol refers to a partially deuterated amphipol.
Ligand structures in their BLT2-bound states.
LTB4 undergoes a significant conformational adaptation upon binding to the BLT2 receptor. In contrast to what is observed with free LTB4 in solution, interdipolar 1H-1H distances deduced from NOE measurements indeed lead to an convergent ensemble of highly constrained structures, the seahorse conformation (Fig. 3 & 4).
Concerning the second agonist, 12-HHT, this study will be mentioned soon here (manuscript under preparation, [9]).
For further information, see ref 5 and soon ref 9.

Figure 3:
Conformational adaption of LTB4 upon binding to BLT2.
Figure 4: Three-dimensional structure of LTB4 associated to BLT2.
(a) Experimental NOE-based distance restraints used in the structure calculation represented by dotted lines on a regular icosagon symbolizing the eicosanoid (in green, blue, red, and black distant restraints obtained with mixing times τm = 50, 100, 200, and 500 ms, respectively. See also SI in ref 5).
(b) Two different views of an ensemble of 10 energy-minimized conformers (in white, hydrogen atoms; in red, oxygen atoms; carbon atoms are assigned a different color for each conformer). Numbers indicate the two hydroxyl groups on positions 5 and 12.
(c) Superimposed structures of LTB4 (in green) and of arachidonic acid bound to the adipocyte lipid-binding protein (in cyan, from ref 8 pdb access number 1ADL). Hydrogens of the arachidonic acid have been omitted for clarity.

In collaboration with
Jean-Louis Banères
(IBMM, Montpellier)
(Marjorie Damian, Aimée Martin)
Eric Guittet
(ICSN, Gif/Yvette)
(Carine van Heijenoort)
Marc Baaden
(IBPC, Paris)
(Samuel Murail)
Bibliography (in blue from the lab):
- Ring et al. (2013) Nature, 502, 575. (Pubmed)
- Manglik et al.(2017) Annu Rev Pharmacol Toxicol, 57, 19. (Pubmed)
- Popot (2011) Annu Rev Biochem, 79, 737. (Pubmed)
- Popot et al. (2011) Annu Rev Biophys, 40, 379. (Pubmed)
- Catoire et al. (2010) J Am Chem Soc, 132, 9049. (Pubmed)
- Kumar et al. (1980) Biochem Biophys Res Commun, 95, 1. (Pubmed)
- Balaram et al. (1972) J Am Chem Soc, 94, 4015. (Pubmed)
- LaLonde et al. (1994) J Biol Chem, 269, 25339. (Pubmed)
- Murail et al. (2017) In preparation.

